The Question
There are multiple expected fantasy points (XFP) models out there. The most accessible public option is the publicly available XFP model (via NFLFastR). The test: take a player's XFP per game in Year N, and see if it signals future performance (FP/G in Year N+1). Then, we'll examine our fantasy over/under performance metric (OEX%) to see if our models can better capture stickiness for overperforming opportunity as a skill signal. Finally, we'll validate our Adjusted Games Played (Adj GP) metric against raw games played as a denominator.
Public Model Limitations
The nflverse ffopportunity model is excellent and freely available, but has some limitations that xfpGM addresses:
- No fumbles lost — Fumbles lost are not factored into XFP calculations
- No laterals — Lateral plays (which can result in significant yardage) are excluded
- No 2-point conversions — 2PT attempts and conversions are not included
- Sack plays excluded — Sacks are not counted toward QB XFP in the public model. This is a significant oversight: theoretically, there could have been points on the play had the sack been avoided. xfpGM includes all sack plays in QB passing XFP.
xfpGM addresses all of these, providing a more complete picture of expected fantasy production.
xfpGM Model Architecture
Rather than building one monolithic model, xfpGM uses position-specific models for each play type. Click to see features:
Design goals: Our models aim to capture all plays that generate fantasy points without missing edge cases (sacks, laterals, 2PT conversions). We deliberately avoid features that indicate team strength outright — no team identifiers, no opponent adjustments in the model itself. The goal is pure opportunity measurement.
Study 1: XFP Stability & Predictive Power
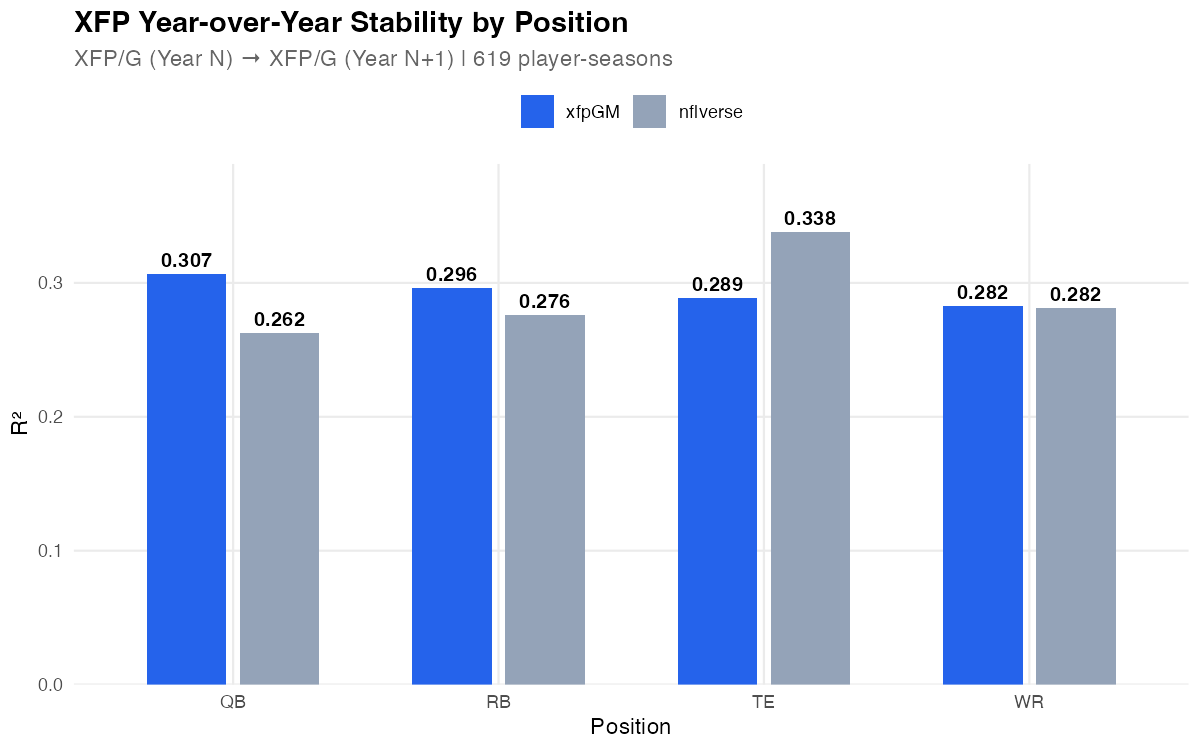
A good XFP model should produce stable, predictable opportunity metrics. If a player's XFP/G is highly variable year-over-year (beyond actual role changes), the model may be capturing noise rather than true opportunity.
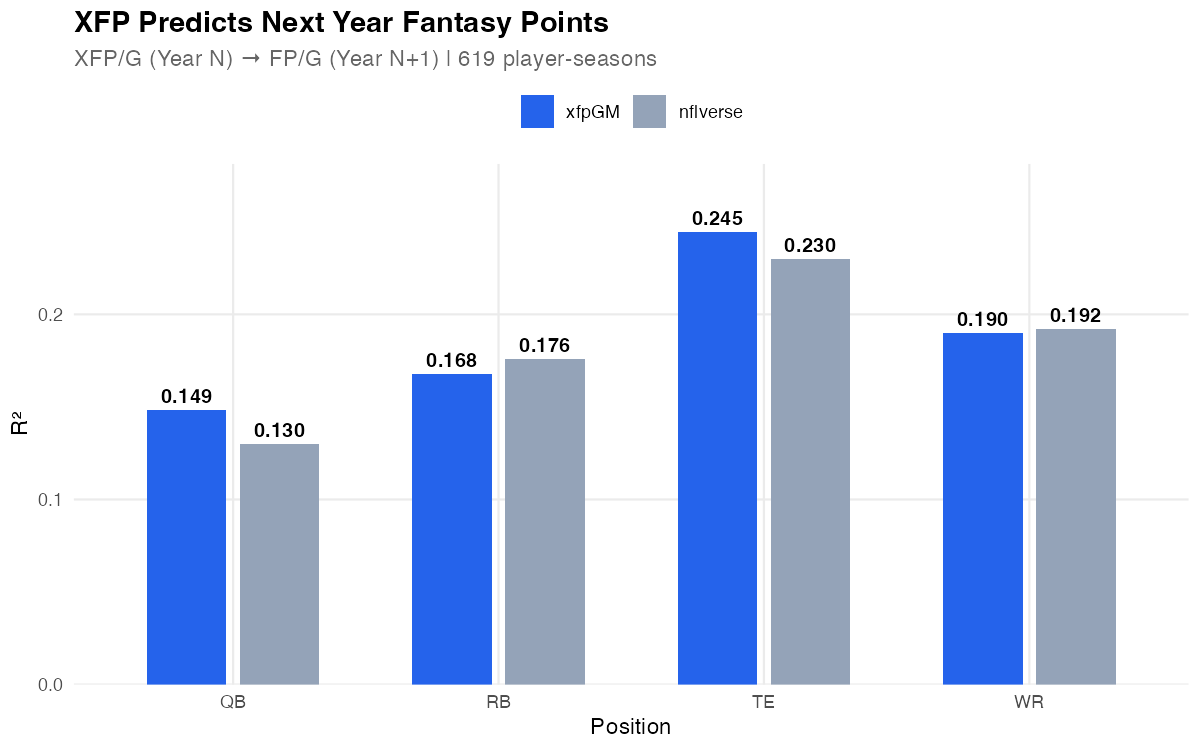
The test: How well does XFP/G in Year N predict XFP/G in Year N+1? And how well does it predict actual FP/G?
XFP Stability by Position
XFP → FP Prediction by Position
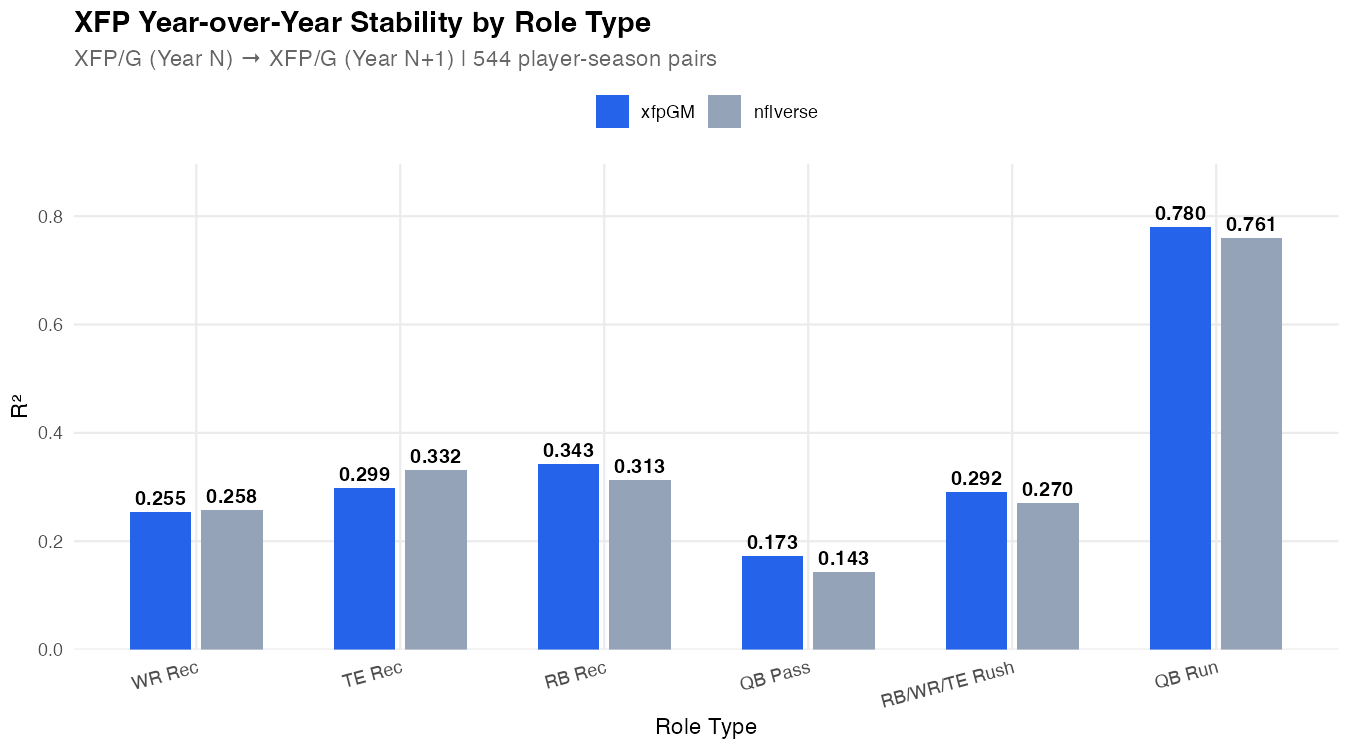
XFP Stability by Role Type
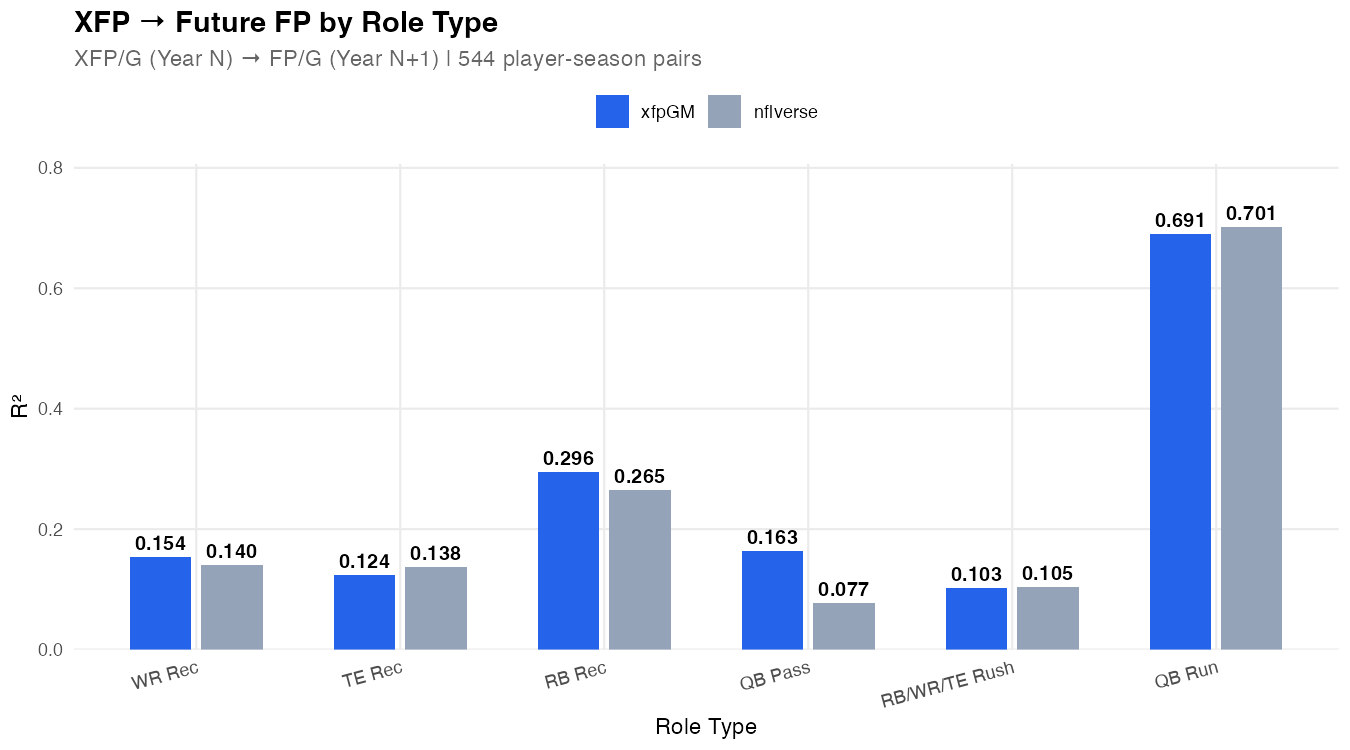
XFP → FP Prediction by Role Type
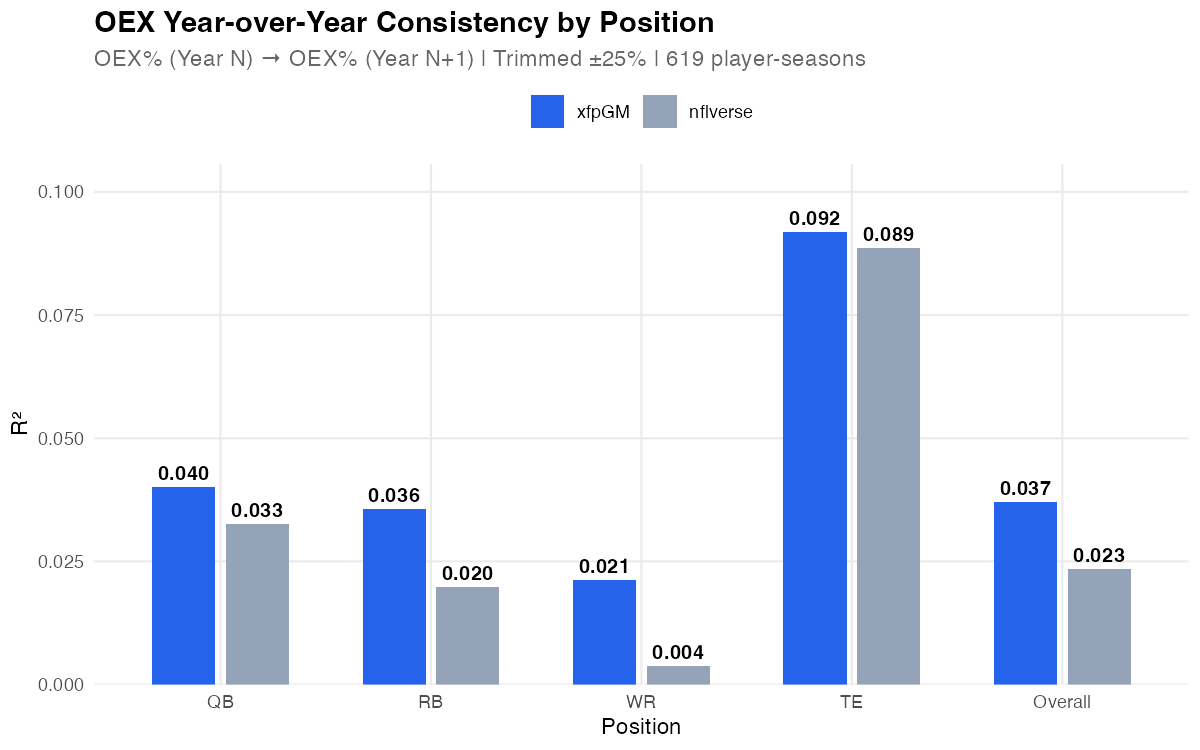
Study 2: OEX Consistency
OEX% (Over Expectation %) measures how much a player exceeded or underperformed their expected fantasy points. We believe there is a skill component to outperforming expectations — elite players consistently beat their XFP. A model that captures this should show some OEX persistence year-over-year.
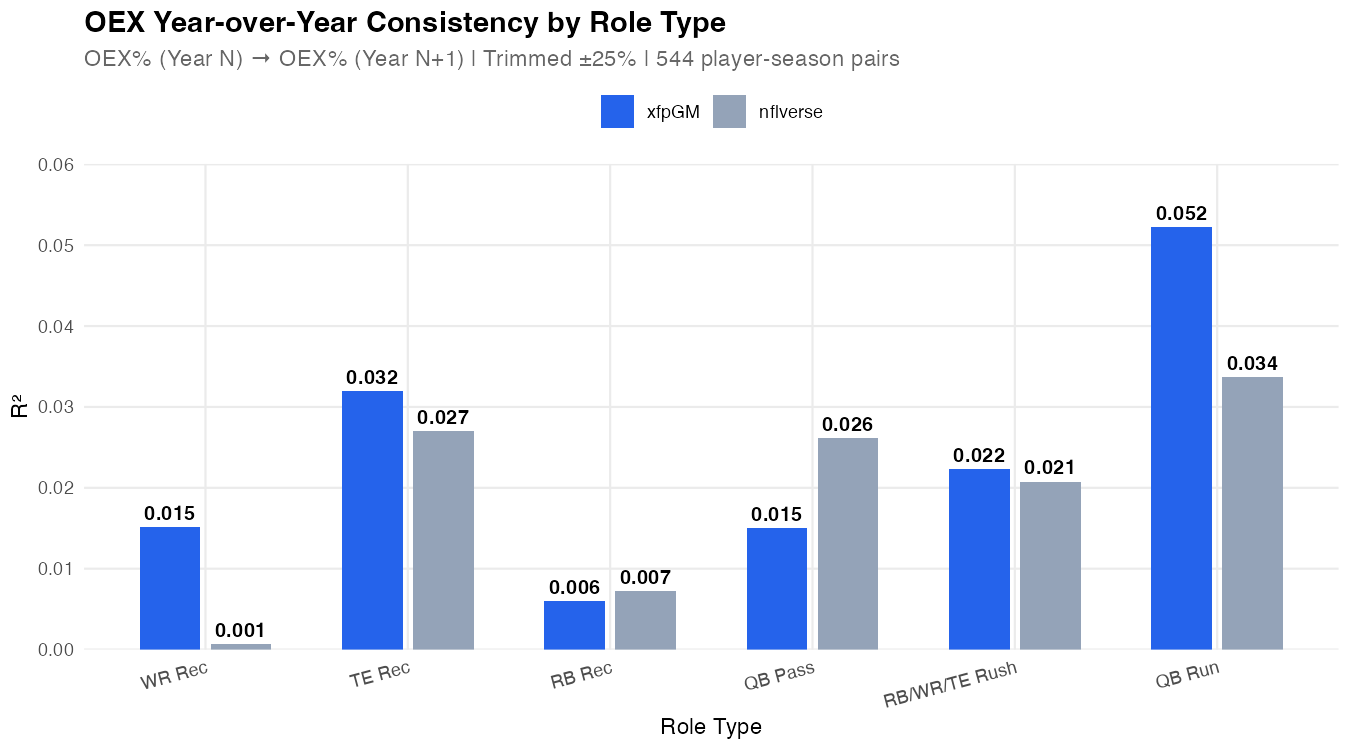
The test: How well does OEX% in Year N predict OEX% in Year N+1? (OEX trimmed to ±25% to reduce outlier influence)
OEX Consistency by Position
OEX Consistency by Role Type
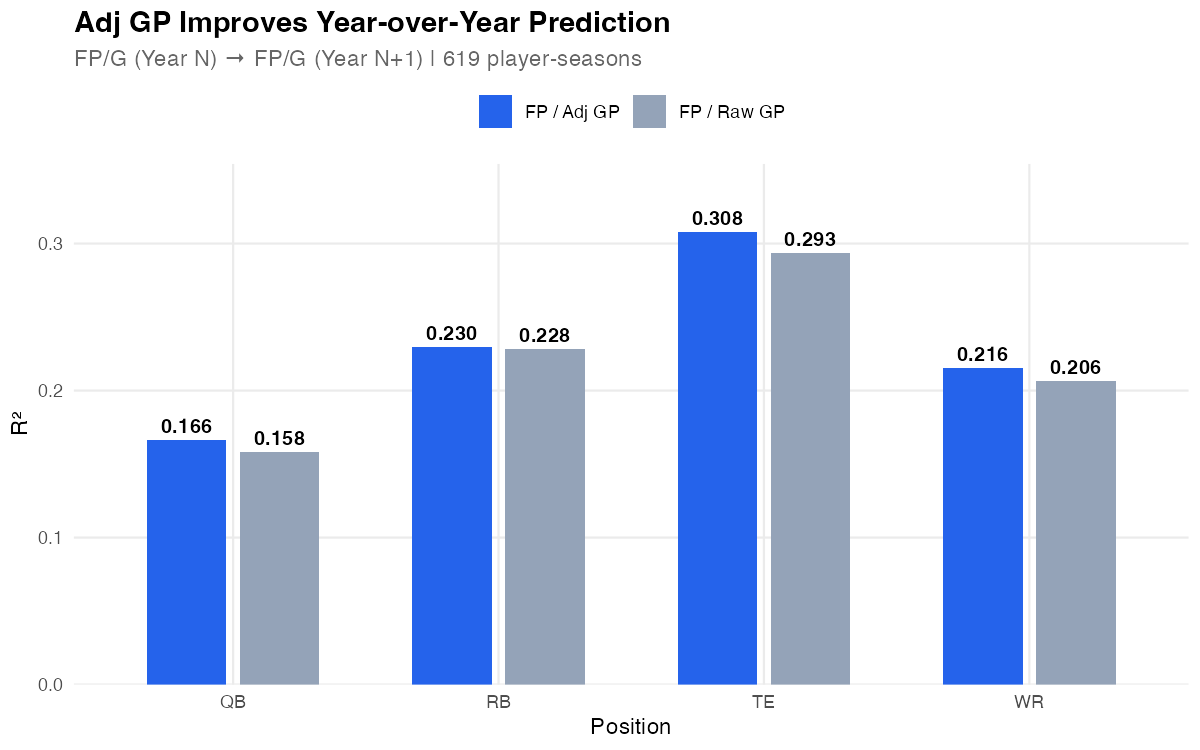
Study 3: Adjusted Games Played
Traditional fantasy analysis uses raw games played (GP) as the denominator for per-game stats. But this treats a player who left in the first quarter the same as one who was active the full game.
Adjusted Games Played (Adj GP) counts only quarters where a player recorded at least one snap. A player who plays 3 quarters gets 0.75 Adj GP, not 1.0 GP. This better isolates true per-game production, by negating the noise from in-game injuries, or rest in meaningless games.
The test: Does FP/Adj GP predict next year's FP/G better than FP/raw GP?
Summary
| Study | Finding | Winner |
|---|---|---|
| XFP Stability | xfpGM +0.9% | xfpGM |
| XFP → Future FP | xfpGM +0.5% | xfpGM |
| OEX Consistency | xfpGM +1.4% | xfpGM |
| Adj GP vs Raw GP | Adj GP +0.7% | Adj GP |
Methodology
619 player-season pairs (2016-2024 → 2017-2025) | Min 8 GP both years | FP/G thresholds: QB≥15, RB≥8.5, WR≥8.5, TE≥7 | Half-PPR scoring | OEX trimmed ±25%