As a refresher: XFP (Expected Fantasy Points) is what we expected a player to score over the course of the year, on average, given the opportunities they received. Fantasy Points are the actual totals we know and love. OEX% is the percentage a player exceeded or fell short of their expected fantasy points.
Think of XFP as a metric of opportunity, and OEX as a metric of execution.
The Claim: "OEX Is Just Luck"
The conventional wisdom is that OEX doesn't repeat. And at first glance, the data supports this: across all qualified player-season pairs (Year N → Year N+1), overall R² is just 6.2%. For reference, our previous analysis showed XFP's R² is closer to 30% — opportunity is far more stable than execution.
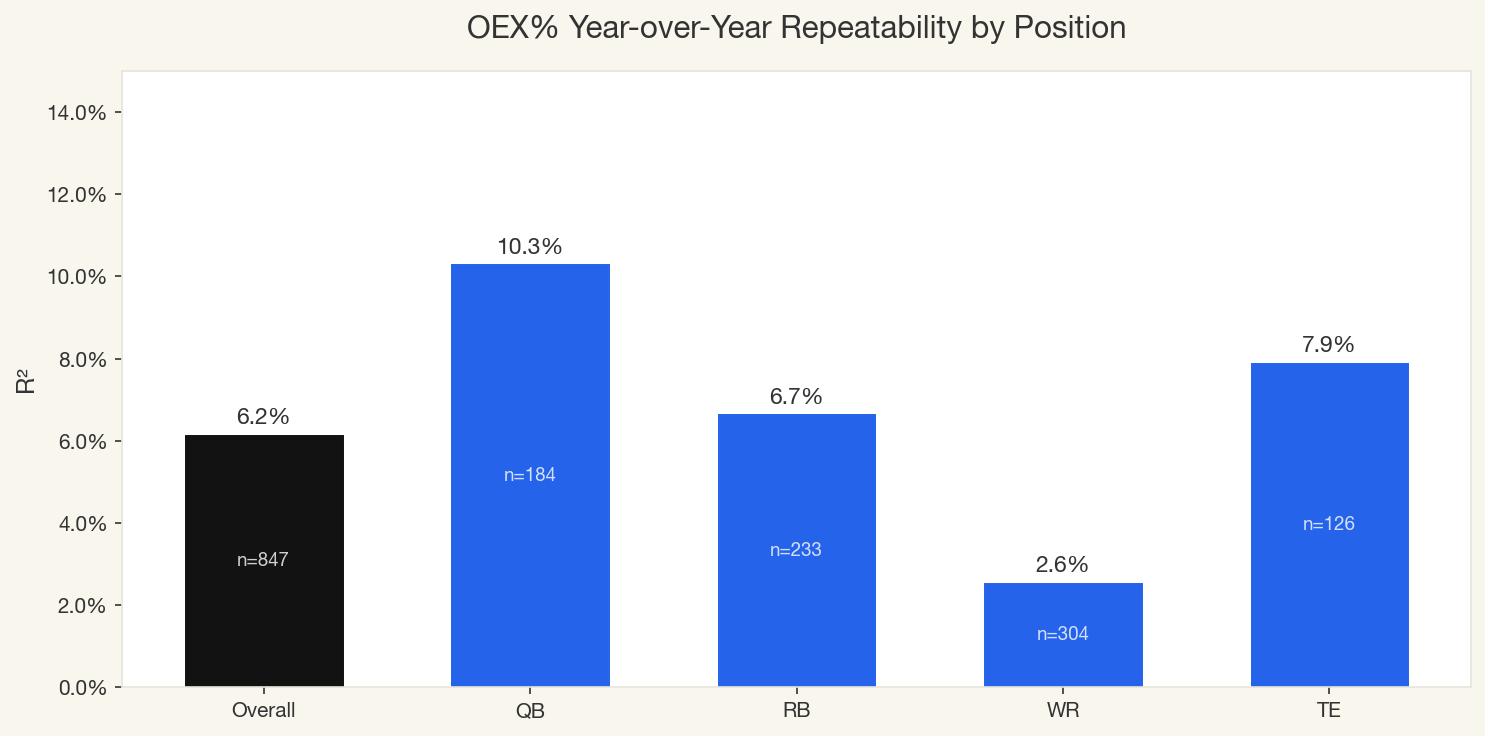
By position, the picture varies — but nothing screams signal. For context, an R² of 5% means 95% of the variation in next year's OEX is explained by something other than this year's OEX.
But this is the wrong way to look at it. Lumping all positions, all coaching situations, and all environments together is like measuring the predictability of "sports scores" without specifying the sport. The signal gets drowned by noise from situations where you should never expect repeatability — new coaches, red zone OEX. When you slice the data correctly, the picture changes dramatically.
The Key Variable: Same Coach, Same Scheme
First, we looked at overall team OEX consistency:
O-Coach definition: We use the HC as the offensive play-caller when he is offensive-minded (e.g. Shanahan, McVay). When the HC is defensive-minded (e.g. Tomlin), we use the OC.
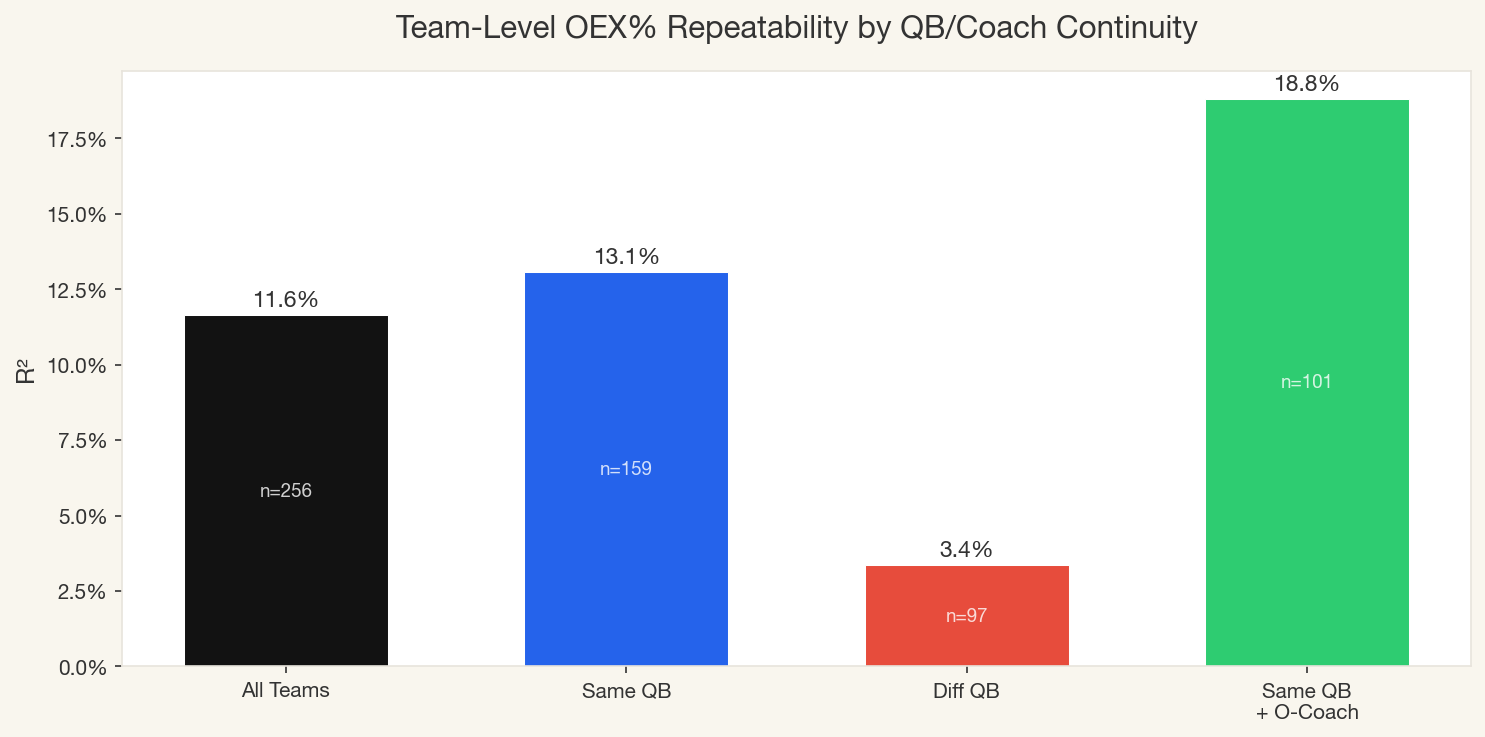
At the team level, OEX repeatability jumps from 11.6% (all teams, n=256) to 13.1% with the same QB (n=159), and drops to just 3.4% with a different QB (n=97). When both the QB and O-Coach return, R² reaches 18.8% (n=101). The bottom line: under consistent offensive situations, team-level OEX is somewhat predictable.
This is also visible at the player level:
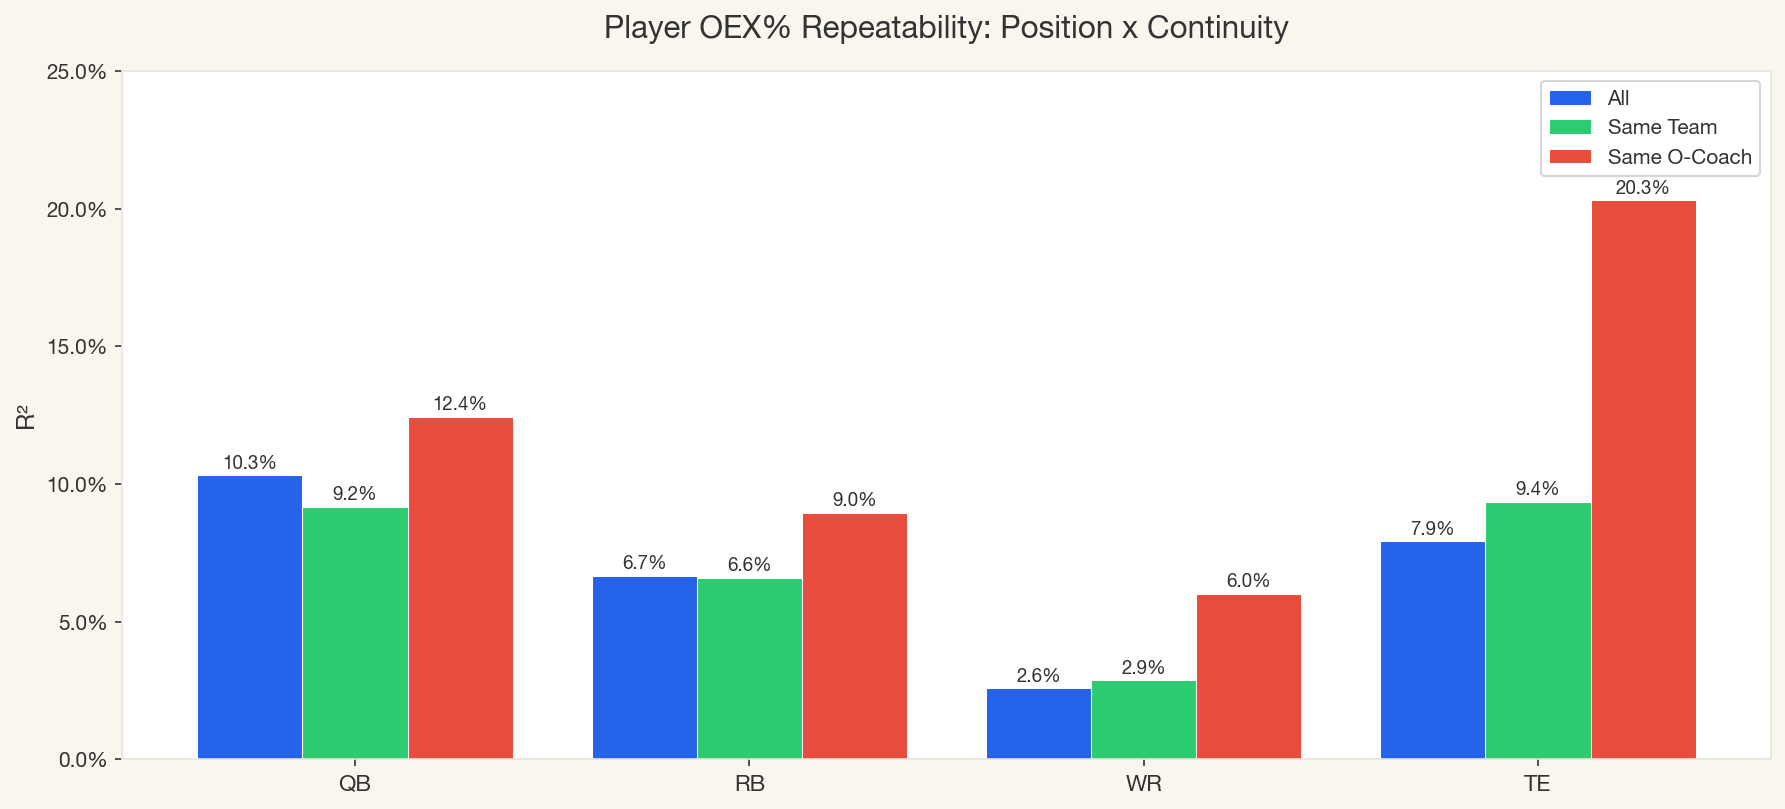
Ok, so we now know there is a semblance of predictive power to be had — so what?
Here are eight scenarios to consider, based on whether the player's prior OEX was positive or negative, whether the team's OEX was positive or negative, and whether the offensive play-caller returns:
| Player | Team | Coach | n | Curr OEX | Next OEX | Info |
|---|---|---|---|---|---|---|
| + | + | Returns | 254 | +14.2% | +6.9% | + |
| + | + | New | 120 | +12.6% | +2.2% | + |
| + | − | Returns | 71 | +7.6% | +2.5% | |
| + | − | New | 67 | +8.4% | +1.5% | |
| − | + | Returns | 52 | −5.9% | +1.0% | + |
| − | + | New | 49 | −8.1% | −1.0% | + |
| − | − | Returns | 86 | −10.7% | −2.1% | + |
| − | − | New | 148 | −10.9% | −1.2% |
Year N uses standard XFP/G qualification thresholds. Year N+1 uses 90% of Year N thresholds to reduce survivorship bias. n=847 total pairs.
Position Deep-Dives
We've established that coaching continuity and team-level OEX are the foundation for predicting player OEX. Now let's go deeper by position. For each, we show R² (how predictable) and the regression slope (how much of prior OEX is retained) across different situations.
Tight end is where OEX repeatability is strongest, by a wide margin. TEs are heavily scheme-dependent; their usage, alignment, and role in the passing game are dictated by the offensive system more than any other position.
| Slice | R² | Slope | n |
|---|---|---|---|
| All TEs | 8.3% | 0.29 | 126 |
| Same O-Coach | 20.4% | 0.483 | 75 |
| Different O-Coach | 0.0% | 0.014 | 51 |
| High Opportunity | 16.6% | 0.506 | 63 |
| Low Opportunity | 3.2% | 0.145 | 63 |
With the same O-Coach, TEs retain 48% of their prior receiving OEX (slope = 0.48) — meaning a TE who was +10% OEX last year projects to roughly +4.8% next year under the same play-caller. With a different coach, that drops to just 1% retention — effectively a blank slate.
High-opportunity TEs tend to dominate the Same O-Coach category, but there still is clear evidence that TEs who are given the ball a lot tend to have more predictable OEX than lesser volume TEs.
The Eight Scenarios — All Positions
Let's revisit our 8 scenarios one more time and see if anything changes when we split by position:
| Player OEX | Team OEX | O-Coach | Sample Size | Avg Current OEX | Avg Next OEX |
|---|---|---|---|---|---|
| + | + | Returns | 254 | +14.2% | +6.9% |
| + | + | New | 120 | +12.6% | +2.2% |
| + | − | Returns | 71 | +7.6% | +2.5% |
| + | − | New | 67 | +8.4% | +1.5% |
| − | + | Returns | 52 | −5.9% | +1.0% |
| − | + | New | 49 | −8.1% | −1.0% |
| − | − | Returns | 86 | −10.7% | −2.1% |
| − | − | New | 148 | −10.9% | −1.2% |
Year N uses standard XFP/G qualification thresholds. Year N+1 uses 90% of Year N thresholds to reduce survivorship bias. n=847 total pairs.
Also, don't forget: if a player underperforms OEX substantially, they might not even get the ball anymore. Read the negative-OEX rows as: given a player continues to get work, if they had a bad year, what do they regress back to?
What You Can Safely Dismiss
As you may have noticed in the previous tables, we included an option to strip out Year N's red zone production when predicting Year N+1. What we found is that for most positions, the toggle made no positive difference — and in the case of running backs, it actually made things noisier. Rest assured, we have a conclusion for you here as well:
Red Zone OEX%: Noise for Everyone
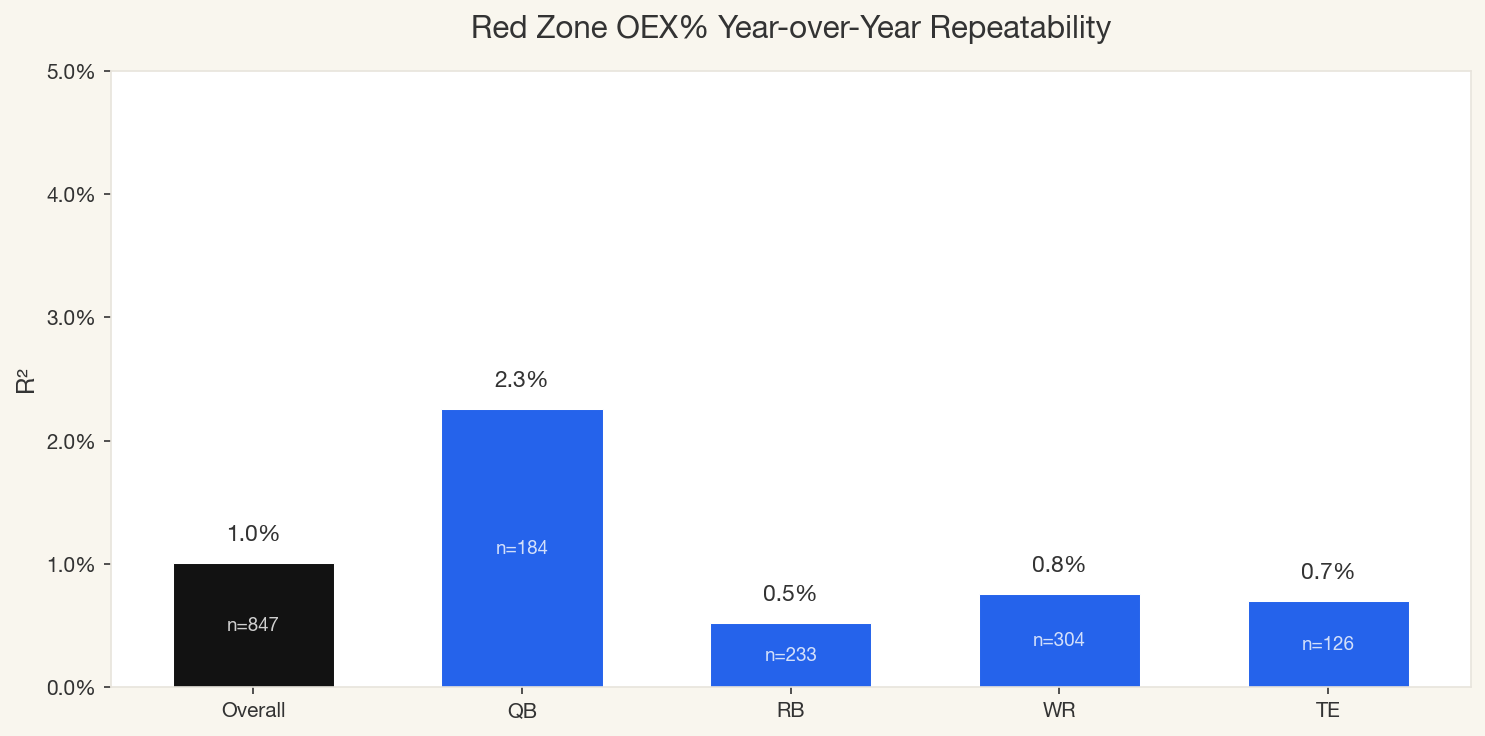
Red zone OEX doesn't repeat for any position, under any conditions. The best we found was QB RZ at 2.3%, RB at 0.5%, WR at 0.8%, and TE at 0.7% — all under 3%. We tested RZ OEX with coaching continuity, positive filters, and fantasy-type breakdowns — nothing meaningful emerged.
The Ceiling: What Machine Learning Reveals
To answer a fundamental question — how much real signal exists in OEX, when you throw everything at the wall? — we built machine learning models. We took all the metrics we have at our disposal on this site to see how good we can get predicting the " unpredictable."
Naturally, we used bagging techniques to avoid overfitting and make sure our predictions are valid for future results. The models use 180+ features per position: team offensive context, QB decision metrics, efficiency splits by situation — all alongside the coaching continuity and team-level OEX variables we've already established as foundational.
| Position | Baseline R² | Full ML R² | Lift |
|---|---|---|---|
| QB | 8.7% | 12.2% | +3.5pp |
| RB | 1.9% | 8.5% | +6.6pp |
| WR | 2.2% | 6.4% | +4.2pp |
| TE | 6.0% | 22.0% | +16.0pp |
The results highlight two things:
- There are real grounds to prove that these metrics can increase our OEX predictability. Every position shows meaningful lift — even WR OEX, which appeared to be pure noise, triples to 6.4% R² when the model can see team context and play-style features.
- There is still so much room to be more precise. Even at the ceiling, 80%+ of OEX variance remains unexplained. The signal exists, but it's far from deterministic.
And there's a reason why ML has — and likely will never — be able to dominate fantasy purely using a model on advanced data. The nuances, the interactions, the year-to-year changes in coaching, personnel, and scheme are all difficult to isolate in their impact. In these environments, models don't win; intuition does. Here, we just supply you with all the information you could need to connect the dots and have the best process possible.
Conclusion
OEX is not all luck. Given specific circumstances, it can be almost as predictable as the player's actual opportunity. The truth is just more nuanced:
- Coaching continuity is the single most important variable. Across every position, same O-Coach dramatically increases OEX predictability. A new play-caller is a reset button.
- Team-level OEX is the anchor. Players regress toward their team's OEX level, not toward zero. The offensive environment matters more than individual history.
- TE OEX is the most actionable signal. With the same coach, TEs retain nearly half their prior OEX (slope = 0.48, R² = 20.4%). Always factor OEX into TE evaluation.
- QB passing OEX is real. 13.1% R² with same coach — good QBs carry some efficiency regardless of system.
- RB OEX is about context. Overall RB OEX with the same coach is 9.0% R², but strip out the red zone noise and it jumps to 18.6% — the strongest non-TE signal we found. RBs get the lion's share of red zone work, so their OEX% is heavily distorted by TD luck. Focus on between-the-20s efficiency in a stable system.
- WR OEX is a tiebreaker, not a driver. 6.0% R² with the same coach — not nothing, but not enough to anchor a projection. Use it to break ties between similar opportunity profiles, not as a standalone signal.
- Red zone OEX is noise for everyone. Under 2.3% R² across all positions. Focus on red zone volume (RZ XFP), not red zone efficiency. The volume — especially at non-RB positions — is the real signal: it tells you who the team trusts to help them score when it matters most.
- QB rushing OEX is noise. 0.9% R² baseline. Don't project rushing efficiency forward.
- The dream scenario is real: a player with positive OEX on a positive-OEX team with a returning coach retains roughly half their edge. That's the one slice worth counting on.
Methodology
Data: 847 player-season pairs across 2016-2024 → 2017-2025. 256 team-year pairs.
Filters: Min 8 Adj GP both years. Year N XFP/G thresholds: QB ≥ 11, RB ≥ 8, WR ≥ 8, TE ≥ 5.5. Year N+1 uses 90% of Year N thresholds (QB ≥ 9.9, RB ≥ 7.2, WR ≥ 7.2, TE ≥ 4.95) to reduce survivorship bias. Min 20 XFP for fantasy-type pairs (~1.2 XFP/game — ensures the player actually fills this role regularly). Half-PPR scoring.
OEX% trimming: Clipped to ±25% to reduce outlier influence.
O-Coach: HC when offensive-minded (e.g. Shanahan, McVay, LaFleur), OC when HC is defensive-minded (e.g. Tomlin, Belichick). Uses the is_offensive_minded classification from our coaching database.
Team OEX: Aggregate (total FP / total XFP - 1) for all qualified players on the team. Primary QB = QB with highest Adj GP per team-season.
R² interpretation: All R² values are from simple linear regression (Year N OEX → Year N+1 OEX). Higher R² means more of next year's OEX variance is "explained" by this year's. Minimum 5 observations required; results with small samples (n < 25) should be interpreted cautiously.
ML models: Bagged stepwise regression (10 bags, 35% random feature subsets per bag, forward stepwise selection within each bag). Evaluation via leave-one-year-out cross-validation — each year held out in turn, model trained on remaining years, predictions pooled for out-of-sample R². Features include team context, QB decision metrics, efficiency splits by situation, and coaching continuity flags — layered on top of the same O-Coach and team OEX variables that drive the simple analyses above.