The Premise
Fantasy points are a product of two things: opportunity and execution. If opportunity is defined as Expected Fantasy Points (XFP) — the points you'd expect given the plays a player was involved in — then execution is defined by OEX% (Over Expectation %), which measures how much better or worse a player converted that opportunity into actual fantasy points.
This research validates the building blocks of XFP as a projection metric: is opportunity stable year-over-year, does it predict future fantasy production, and how much of the actual outcome is execution noise? The answers shape how to weight XFP, OEX, and raw FP when projecting for next season.
xfpGM Model Architecture
Rather than building one monolithic model, xfpGM uses position-specific models for each play type. Click to see features:
Design goals: Our models aim to capture all plays that generate fantasy points without missing edge cases (sacks, laterals, 2PT conversions). We deliberately avoid features that indicate team strength outright — no team identifiers, no opponent adjustments in the model itself. The goal is pure opportunity measurement.
Public Model Limitations
The nflverse ffopportunity model is excellent and freely available, but has some limitations that xfpGM addresses:
- Sack plays excluded — Sacks are not counted toward QB XFP in the public model. This is a significant oversight: theoretically, there could have been points on the play had the sack been avoided. xfpGM includes all sack plays in QB passing XFP.
- No fumbles lost — Fumbles lost are not factored into XFP calculations
- No laterals — Lateral plays (which can result in significant yardage) are excluded
- No 2-point conversions — 2PT attempts and conversions are not included
xfpGM addresses all of these, providing a more complete picture of expected fantasy production.
XFP Is Stable
A good opportunity model should produce stable, predictable metrics. If a player's XFP/G fluctuates wildly year-over-year — beyond actual role changes — the model may be capturing noise rather than true opportunity.
The test: How well does XFP/G in Year N predict XFP/G in Year N+1?
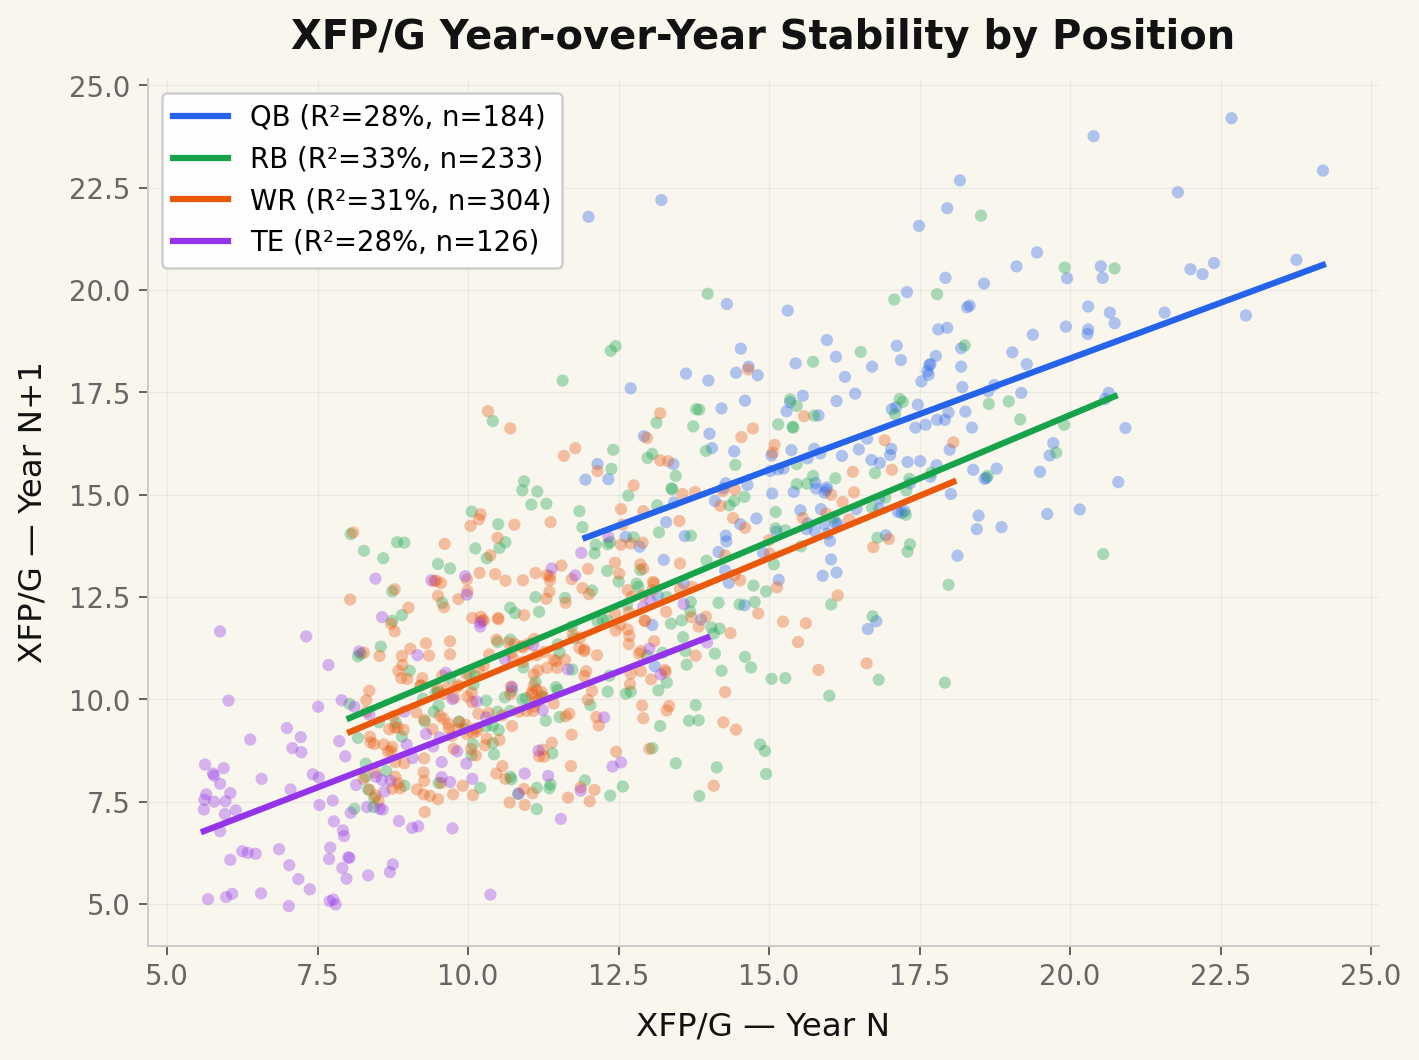
About 30% of a player's per-game opportunity this year can be explained by last year's opportunity alone. That's strong for a single-variable predictor in a sport with this much roster turnover, coaching changes, and injury variance. The R² for a team's win percentage year over year in the NFL doesn't even beat this! Opportunity in fantasy football is largely a function of role and scheme, not luck — making XFP/G a reliable anchor for projecting future opportunity.
XFP Predicts Future Scoring
Stability is good, but the real question for drafters is: does XFP predict actual future fantasy points?
The test: How well does XFP/G predict next year's FP/G? And how does that compare to using actual FP/G as the predictor?
XFP is a measure of pure opportunity, stripping out execution entirely. Even so, it retains most of FP/G's predictive power: XFP/G predicts next-year FP/G at 21% R², while actual FP/G predicts at 27% R². That means XFP alone holds onto roughly 80% of the predictive signal in FP/G. Adding execution information helps at the margin, but opportunity is doing the heavy lifting.
When we strip out players whose usage shifted dramatically — big jumps in snap share, target rate, or role changes — we see this even more clearly. For players whose future XFP/G stayed within ~25% of the previous year's:
With stable usage, XFP/G is just as predictive as actual fantasy points. The gap disappears entirely. The full-sample gap is driven by role volatility (breakouts, demotions, new teams), not a weakness in XFP as a metric.
OEX: The Execution Residual
If XFP measures opportunity, OEX% (Over Expectation %) measures everything else — the execution component. A player with +10% OEX scored 10% more fantasy points than their opportunity predicted. It captures skill, efficiency, and luck in one number.
The natural question: does execution repeat?
Mostly, no. OEX has low year-over-year repeatability. Execution is far noisier than opportunity, and most of what looks like over-performance in a given year doesn't carry forward. But that doesn't mean OEX is all noise. Our research identifies specific situations, like coaching continuity and team context, where execution is meaningfully more likely to repeat.
Adjusted Games Played
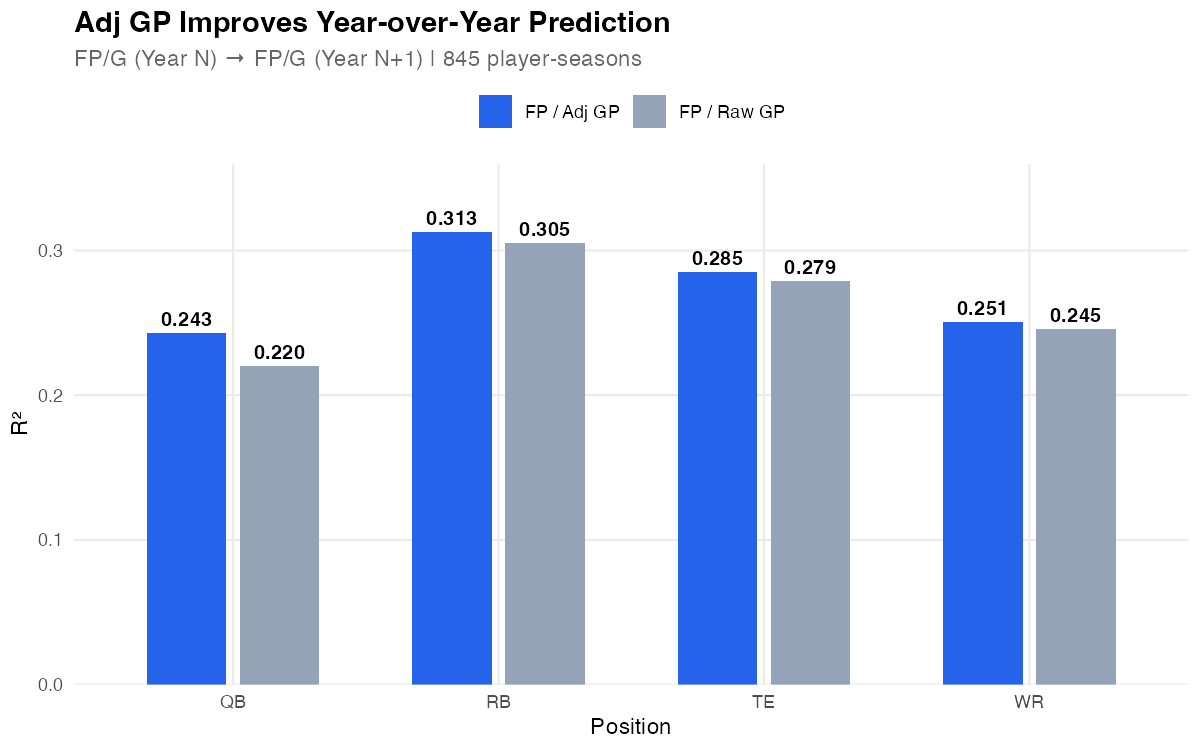
Traditional fantasy analysis uses raw games played (GP) as the denominator for per-game stats. But this treats a player who left in the first quarter the same as one who was active the full game.
Adjusted Games Played (Adj GP) counts only quarters where a player recorded at least one snap. A player who plays 3 quarters gets 0.75 Adj GP, not 1.0 GP. This better isolates true per-game production by negating the noise from in-game injuries or rest in meaningless games.
The test: Does FP/Adj GP predict next year's FP/G better than FP/raw GP?
Takeaways
- With stable usage, XFP/G is just as predictive as actual fantasy points. Across all players, FP/G is slightly more predictive of next-year FP/G than XFP/G (27% vs 21% R²). But among players whose role stayed consistent, the gap disappears entirely (45% vs 45%). The full-sample gap is driven by role volatility (breakouts, demotions, new teams), not a weakness in XFP as a metric.
- OEX is mostly noise, but has pockets of signal. Overall execution repeatability is low (6% R²). Specific contexts like coaching continuity, team strength, and position produce meaningfully higher signal. See the OEX stability research for the full breakdown.
- Adj GP improves everything. Counting quarters instead of games eliminates noise from partial appearances, boosting predictive power across all metrics, especially for QBs.
How This Shapes the Site
The findings above set the agenda for everything you see on xfpGM. If opportunity is the most stable, predictive component of fantasy production, then the job of every metric on this site is to sharpen one of two questions:
- How will a player's opportunity (XFP) shift next year? Coach scheme, target shares, snap rates, depth chart context, free agent movement, rookie landing spots: these are the inputs that explain why a player's XFP/G is about to change. The team, coach, and player pages are built to let you reason through that shift before the season starts.
- How likely is a player to keep beating (or trailing) expectation? OEX is mostly noise in the aggregate, but specific micro stats (efficiency splits, route quality, scheme fit, situation usage) carry signal about which players have a real claim to the execution edge they showed. Surfacing those is what turns OEX from a luck signal into a forward-looking read.
Put together: projected FP/G = projected XFP/G × projected (1 + OEX%). The site exists to help you fill in both halves of that equation with more than a gut feel.
Methodology
845 player-season pairs (2016-2024 → 2017-2025) | Min 8 Adj GP both years | Year N XFP/G thresholds: QB≥11, RB≥8, WR≥8, TE≥5.5 | Year N+1 uses 90% of Year N thresholds to reduce survivorship bias | Half-PPR scoring | OEX trimmed ±25%